Part 1 of a series
How a Diagnostic Call Works: Nameplate Photo to Live Data
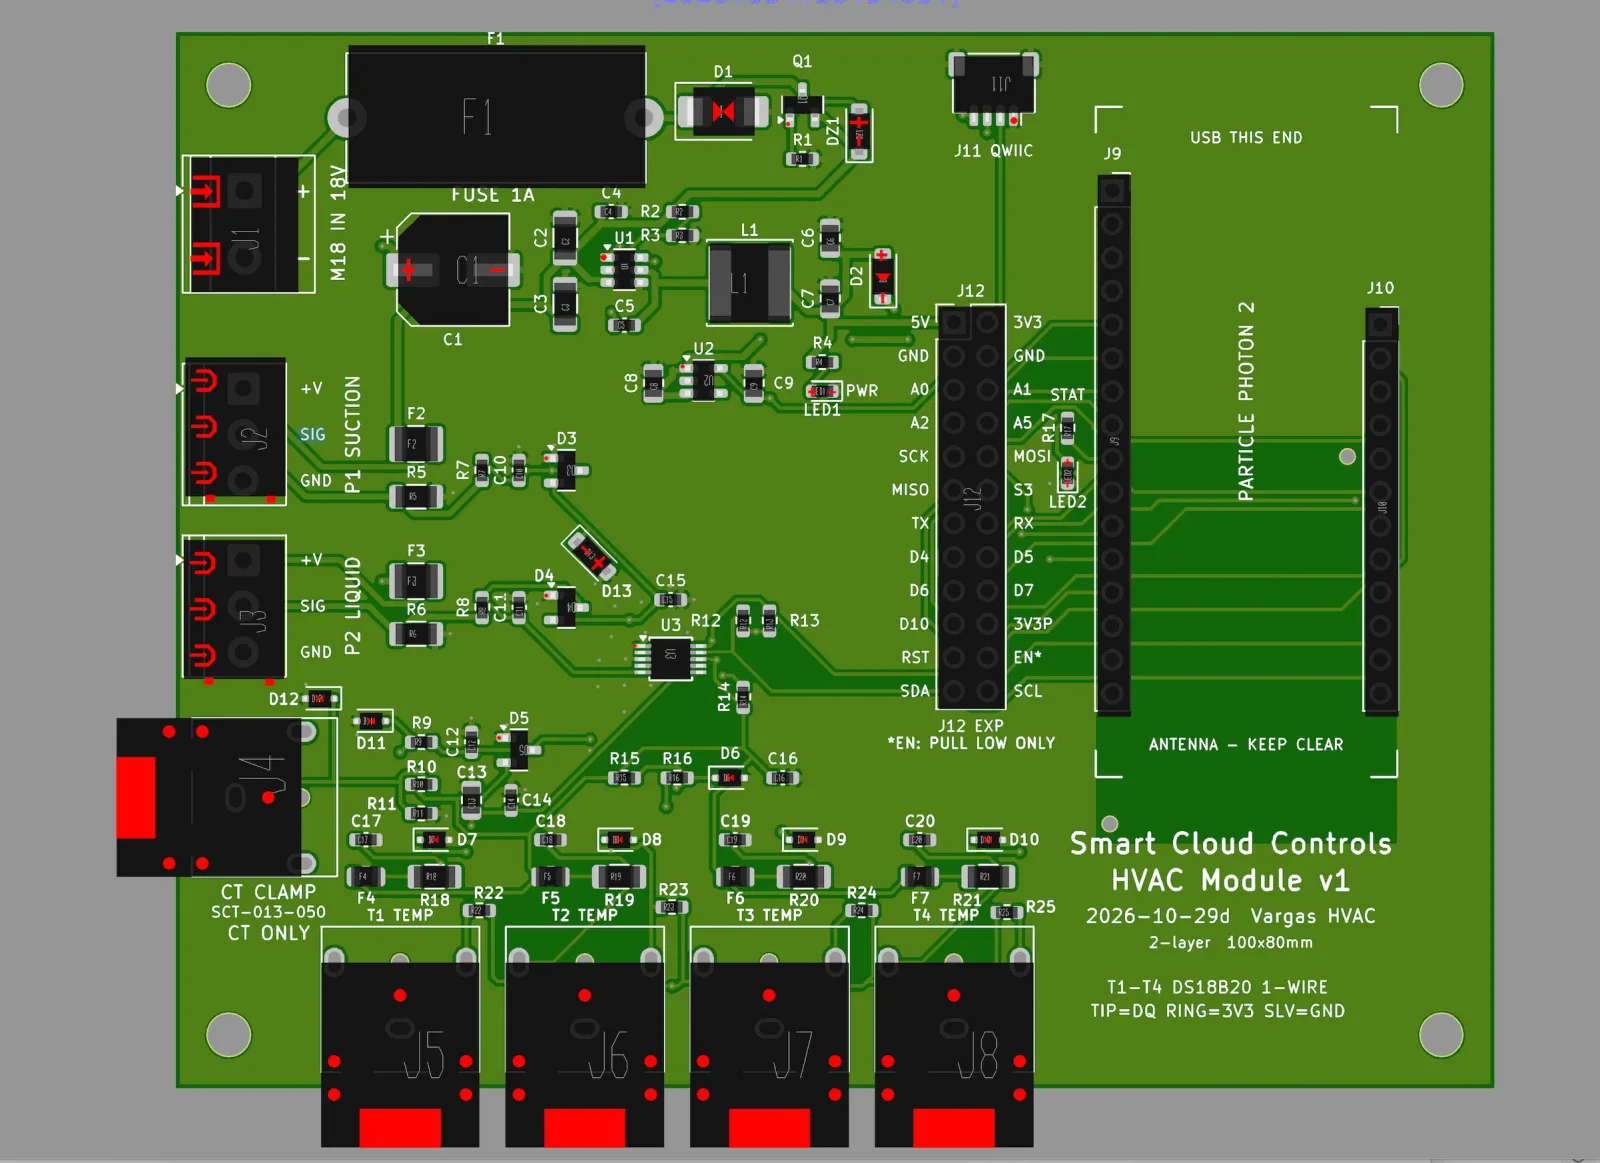
This is the first post in a series about converting our monitoring device into a diagnostic setup. Later posts will cover installing the sensors, what the data looks like on a running system, and how the readings change a technician’s diagnosis. This one explains what the setup does and how a diagnostic call runs.
From monitoring to diagnostics
Our device was built to monitor a system: temperatures, pressures, and current draw, recorded over time and sent to the cloud. Monitoring answers a long-term question — is this system behaving the way it should across days and weeks?
A diagnostic call asks a narrower question: what is this system doing right now, and why? That takes a complete set of readings, captured at the same moment, tied to one unit, and available to more than the person holding the gauge. The same hardware can do both. That is the conversion this series follows.
What a diagnostic call records
Five things go on the system before any diagnosis is made.
- Suction and liquid line pressure
- The high and low side of the system, read from the service ports.
- Line temperature
- Suction and liquid line temperatures, taken at the same points as the pressures.
- Amp draw
- Current draw at the compressor, recorded continuously instead of read once.
- Supply and return air temperature
- The air temperature drop across the coil, captured with the rest of the readings.
- Humidity
- Return air humidity, because a system can hold temperature while moisture handling slips.
The nameplate photo
Before the sensors go on, the technician photographs the unit’s nameplate. Model, serial number, tonnage, and refrigerant type come from that photo and attach to the unit’s record.
From then on the readings belong to a specific system rather than to a page in a notebook. That matters on a property with several identical units, where telling one unit’s data from another’s is the whole point.
One board for the whole job
We designed a custom board so every relevant reading could be taken and recorded in one place. The sensors connect to a single device that records all of them together, at the same moment, instead of a pressure gauge here, a thermometer there, and an amp clamp on the compressor lead.
The difference is not only fewer tools. Readings that are recorded are readings the team can review, compare, and come back to. Nothing depends on what was written down by hand.
A reading every ten seconds
The device logs every channel every ten seconds for as long as it stays on the system. That is frequent enough to catch a system that starts, runs briefly, and stops — behavior a single set of readings tends to miss — and it produces a continuous record instead of a snapshot.
One link for your team
Each diagnostic session publishes a link. A technician can open it at the unit, the office can open it at the same moment, and anyone following up can open it later. Everyone is looking at the same readings instead of a description of them relayed by phone.
What changes on a call
A conventional diagnostic visit produces a set of numbers — some written down, some remembered — and the system’s behavior outside that window stays unknown. A diagnostic call with the device produces a record: the same readings, at a fixed interval, attached to a nameplate, available to the team.
The technician’s judgment does not change. What changes is how much of the evidence survives the visit.
What’s next in the series
Later posts will cover installation on a running system, what the first days of data look like, and how a record from a diagnostic call changes the follow-up visit. If you want this running on a system, get in touch.
Want this on a system?
Tell us what the system is doing and we will walk you through what a monitored diagnostic call looks like.