Built for the Cold Start: One Board for Pressure, Temperature, and Current
I wanted a tool I could hook up while the system was off and the power was off — then turn the system on and watch what happened. Not a set of gauges read at one moment. A recorder, already sampling before the contactor pulls in and still sampling after the fan comes up.
Most of the readings a technician takes describe a system that has settled. The first seconds describe how it got there. A weak capacitor, a compressor pulling more current than the same unit did last year, a pressure switch that takes too long to make, a blower that starts after the compressor — those are start-up events, and a snapshot taken after everything is running cannot show them.
So the requirement was easy to state: pressure, temperature, and current, measured together, on one board, recorded from before start-up, and sent to a database the whole team can open. This is how that board came together.
Start with the system off
With the disconnect open, everything is connected first: pressure transducers on the service ports, temperature probes on the lines, a current transformer clamped around the conductor under test. The board is powered up against a system at rest and takes its first samples before anything moves.
Those samples are the baseline. Pressures equalized, line temperatures at ambient, current at zero. When the contactor closes, the same clock keeps sampling, so the rise is not a separate measurement bolted onto the baseline — it is the next sample in the same series.
The install is calmer that way. Nothing is added to a live panel. Every connection is made and checked before the system is energized.
Three measurements, one board
A refrigeration diagnosis needs three kinds of evidence, and they come from different places:
- Pressure
- Suction and liquid line pressure, from transducers on the service ports. What the gauges would show, recorded continuously instead of glanced at.
- Temperature
- Line temperatures from probes clamped to the suction line, the liquid line, and across the filter drier. With pressure, these become superheat and subcooling.
- Current
- Current draw from a CT clamped around the conductor under test — compressor, fan, or the feed to the unit — so electrical load is measured rather than assumed from the nameplate.
One clock, one timestamp
On separate instruments these readings live in separate logs with separate clocks. On one board they share a power supply, a clock, and a timestamp. That is the whole reason for combining them: a start-up record is only useful if the electrical and refrigerant events sit on the same timeline.
The board is deliberately simple. A Particle Photon 2 handles sampling and upload, with pressure and temperature inputs, the CT input, and the power section around it. The firmware measures, timestamps, and sends; it does not decide what the numbers mean. Superheat, subcooling, current balance, and every other derived value are calculated later from the raw fields, so the rules can change without changing the board.
What fits on 100 by 80 mm
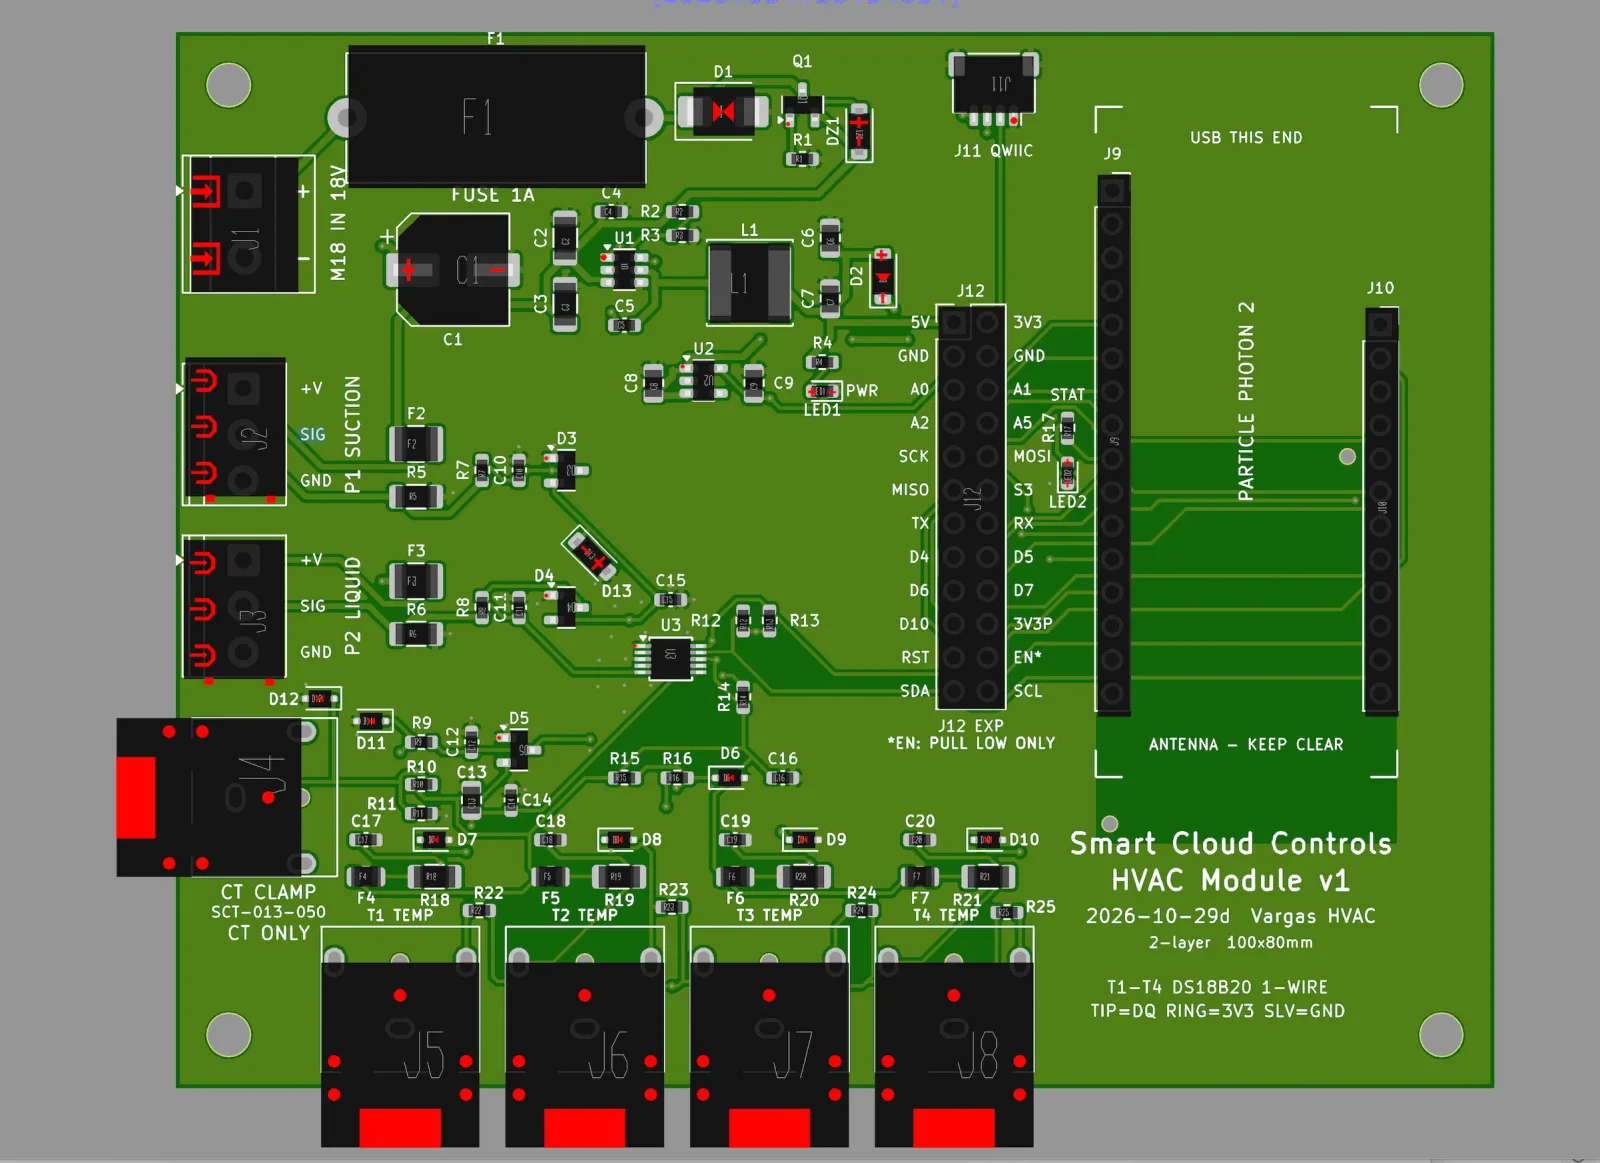
The board is 100 by 80 mm on two layers, and the layout follows the connections instead of the other way around. Power and protection sit along the top edge. The pressure ports run down the left. The temperature jacks and the CT input are on the bottom, where the probes and the clamp actually land. The Photon 2 occupies the right side, with a keep-out around its antenna.
The schematic title block calls it what it is: a Photon 2 HVAC diagnostic module that replaces the breadboard and shield.
Power first
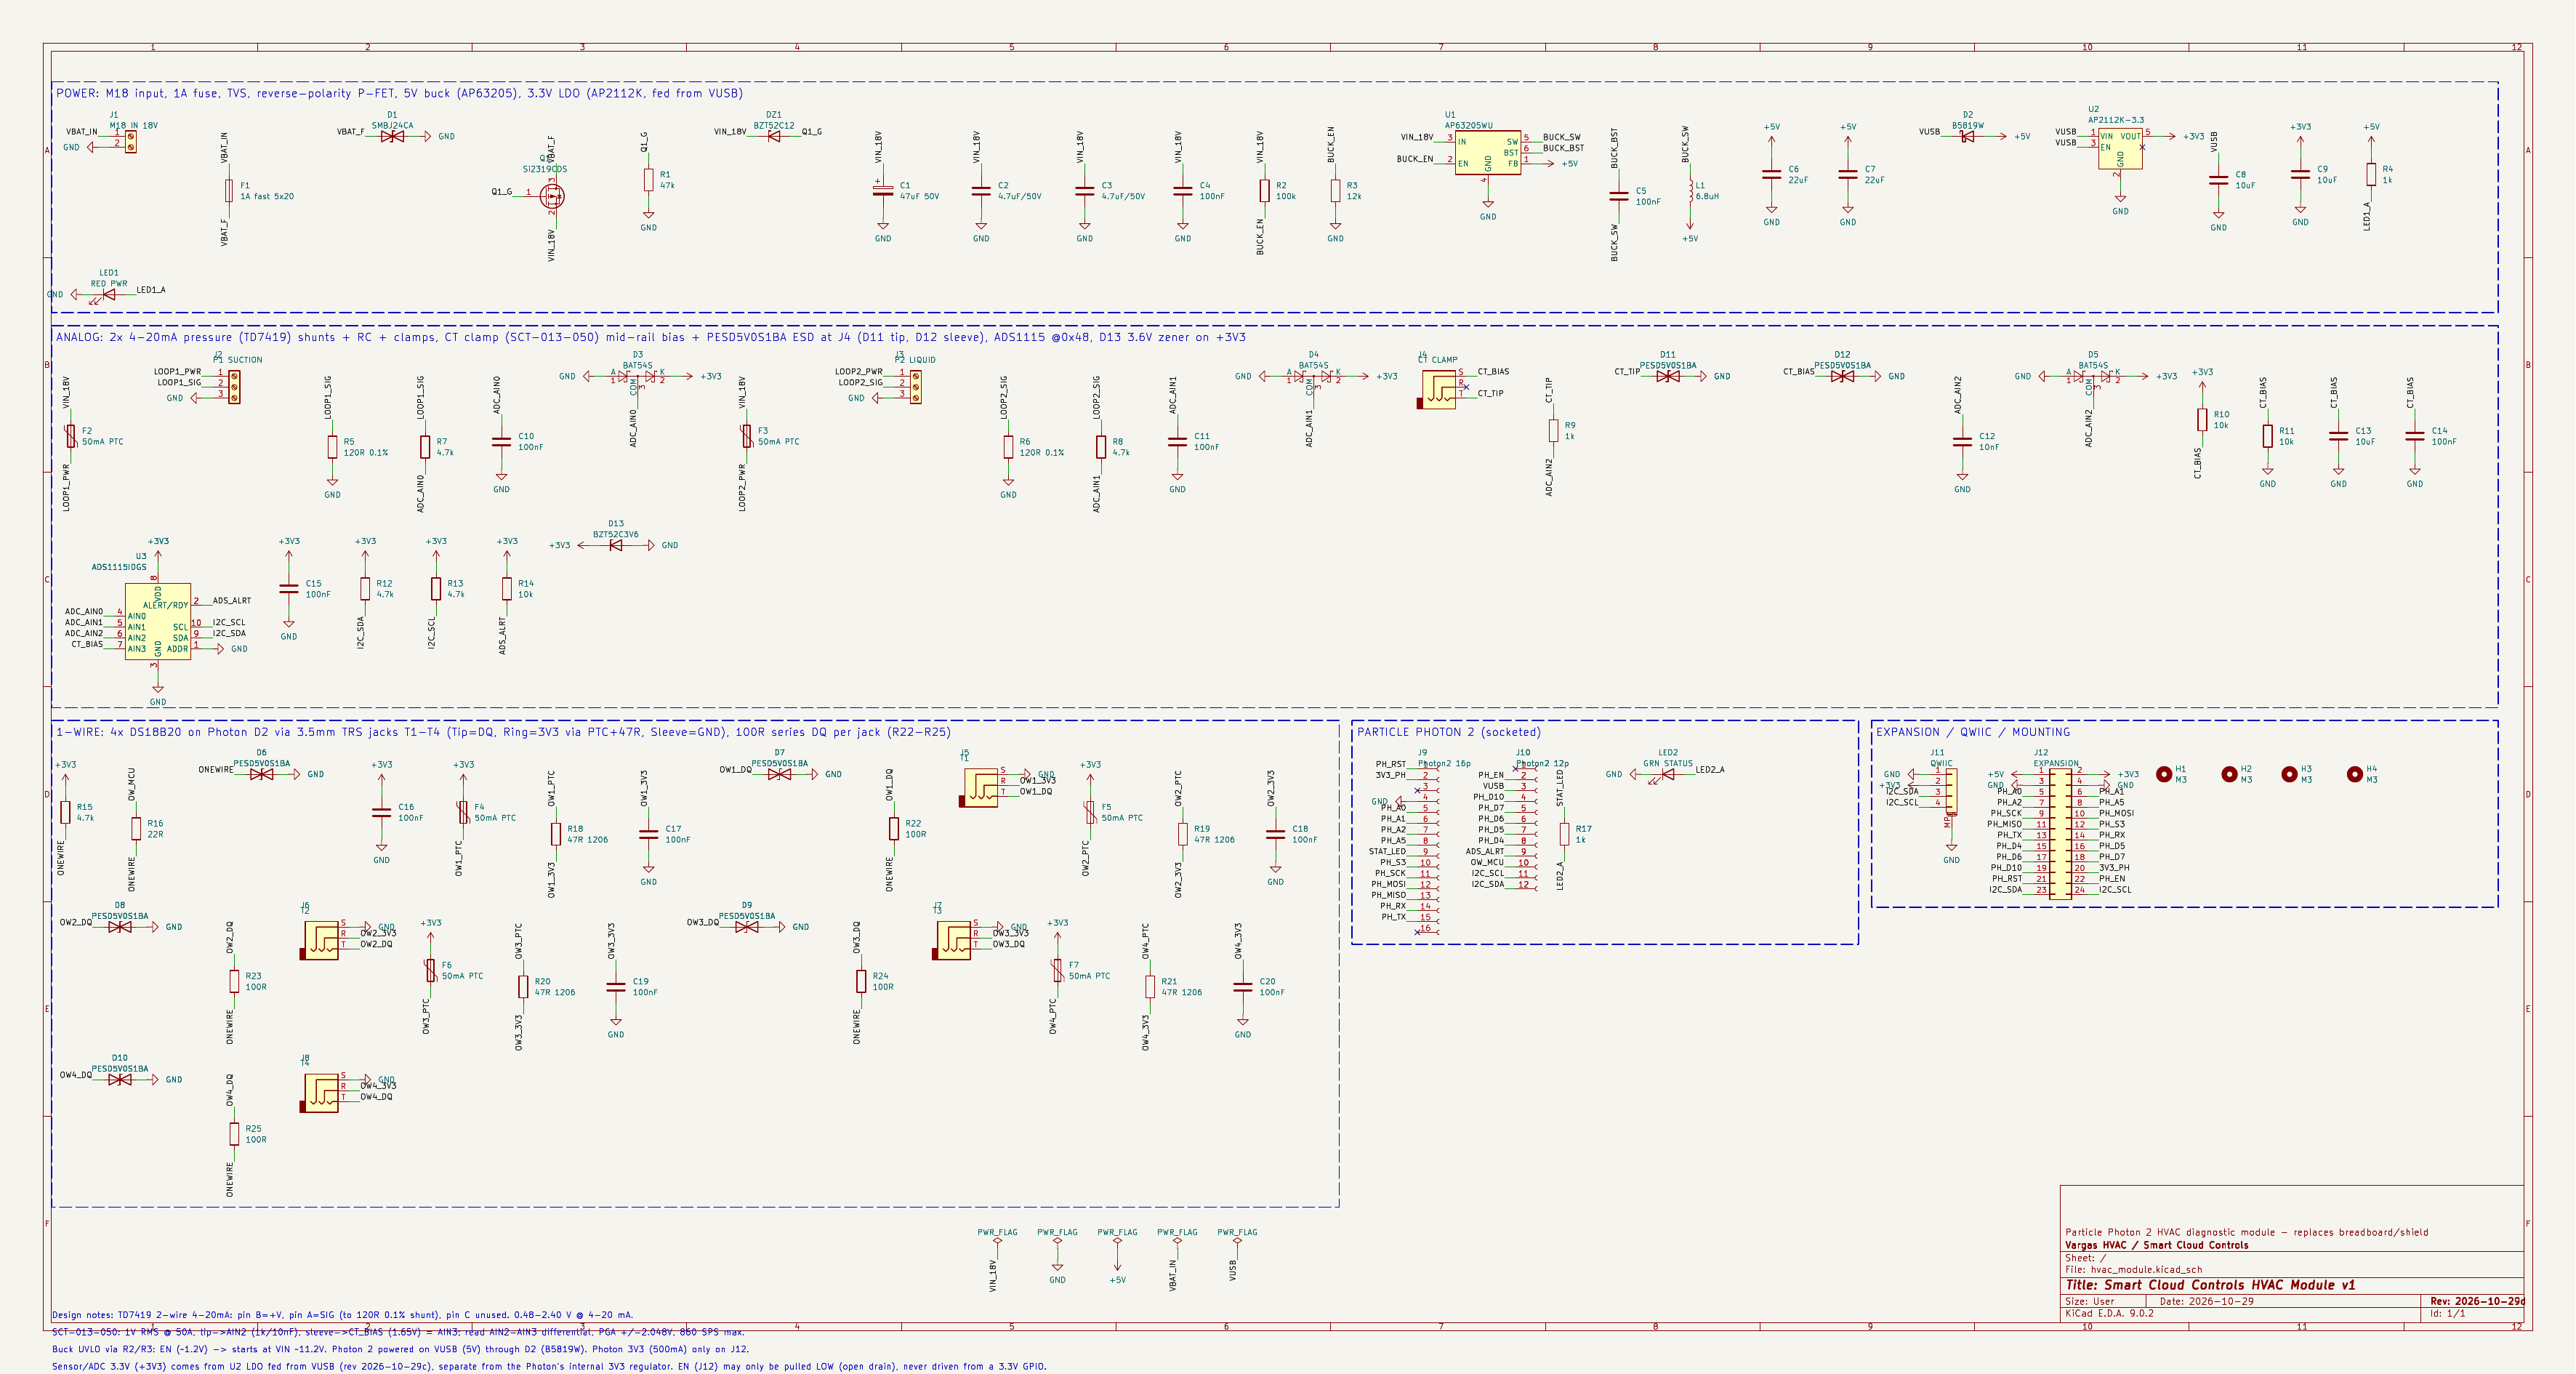
Everything starts at J1: an 18 V input through a 1 A fuse, a TVS, and a reverse-polarity P-FET. From there a 5 V buck does the heavy lifting. Its enable divider holds the converter off until the input reaches about 11 V, so a supply that is still coming up — or sagging — does not half-boot the board.
The Photon 2 runs from that 5 V rail through a Schottky diode, which lets USB power the Photon during programming without backfeeding the buck. The 3.3 V rail for the sensors and the ADC comes from its own LDO, also fed from the 5 V side. It is separate from the Photon’s internal 3.3 V regulator; the Photon’s own 3.3 V is only broken out on the expansion header.
Two loops and a clamp
Pressure arrives as current, not voltage. Both transducers are 4–20 mA, two-wire, loop-powered from the 18 V input through a 50 mA PTC. Each loop lands on a 120 Ω 0.1% shunt, so 4–20 mA becomes 0.48–2.40 V — a range the ADC reads directly. An RC filter and clamp diodes sit between the shunt and the ADC input.
The CT is a different problem. An SCT-013-050 is a voltage-output clamp, about 1 V RMS at 50 A, and its output swings above and below zero. The board biases it at 1.65 V and reads it differentially, with ESD protection right at the jack. A CT lead is something a technician plugs in on a roof; it needs the protection.
One ADC, one bus
Both pressure loops and the CT land on an ADS1115, a 16-bit I2C ADC at address 0x48. Three inputs carry signal; the fourth is the 1.65 V mid-rail the CT is measured against.
Temperature does not go through the ADC at all. Four DS18B20 probes sit on the 1-Wire bus, each on a 3.5 mm jack with a 1 kΩ series resistor on the data line and a 47 Ω PTC on the 3.3 V ring. The jacks make a probe replaceable in the field; the series resistance keeps a damaged jack from taking the whole bus down with it.
The air side travels in smaller modules
Refrigerant readings describe the loop. They do not describe the air crossing the coil. A system can be correctly charged and still fail to cool because the return is restricted, the filter is loaded, or the blower is weak. From pressure and line temperature alone, low charge and low airflow often look similar.
On the hardware side, the answer is a set of small modules rather than a larger main board:
- Return air
- Dry-bulb temperature and relative humidity at the return.
- Supply air
- Dry-bulb temperature and relative humidity after the coil.
- Static pressure
- Duct, filter, and air-handler pressure drop, measured where the restriction is.
Each module sits next to the measurement it takes, so a probe does not need a long cable back to one enclosure. The modules write into the same job record as the main board. The main board covers the refrigerant and electrical side; the small modules cover the air side.
Ten seconds at a time
Every ten seconds the board samples each channel and writes a point with a timestamp. The point goes over HTTPS to our ingest endpoint. Each board has its own device key; the server maps that key to a device id and to the measurements the board is allowed to write, then writes the point to InfluxDB in the hvac_sensors bucket. The read path uses a different token, and the board never holds the database credential.
The timestamp is taken when the reading is taken, not when the upload succeeds. If the network is not up yet — common when the board powers up with the system — samples wait in a queue and are sent later with their original times. A cold start recorded offline is still a cold start in the right order.
Missing stays missing. A value that could not be read is left out of the point rather than sent as zero, so a disconnected probe becomes a gap in the chart instead of a measurement. Derived values wait until the raw fields are in the database.
What a cold start shows
On a healthy system the first minute is boring, and boring is the fingerprint: the contactor closes, the compressor and condenser fan start, current rises to inrush and settles to running amps, pressures move to their running values, and supply air temperature falls once the coil is fed.
On a system with a problem, the same window shows things a snapshot cannot:
- inrush current well above or below the same unit’s earlier visits
- a compressor that starts, runs briefly, and stops
- pressure that never settles at a running value
- fan current that never reaches its expected running value
- a temperature split that takes too long to develop
The technician still makes the diagnosis. What changes is that the first minute is available when they make it — and available to the office on the same link at the same time.
Built for the truck
One board is an install decision as much as an electrical one. Everything lands on labeled terminals, gets connected with the system off, and is checked before the disconnect is closed. There is one device to power, one to put on the network, and one timestamp to trust.
The alternative — a gauge, a thermometer, and an amp clamp, each read at a different moment — produces numbers that have to be reconciled later, if they survive the visit at all. The small modules extend the same idea to the air side without a bundle of wires running back to one enclosure. The main board stays where the refrigerant and electrical connections are. The air modules go where the air is.
What comes next
The board is the part that makes the rest possible. With pressure, temperature, and current on one timeline, the next questions are about coverage: more air-side points, more electrical channels, and a record that starts before every call and keeps running after the technician leaves.
If you want this running on a system, get in touch.
Want this on a system?
Tell us what the system is doing and we will walk you through what a monitored diagnostic call looks like.